Monday, June 23, 2025
Master the Social Media Analytics Dashboard in Minutes

Building Your Digital Command Center From Scratch
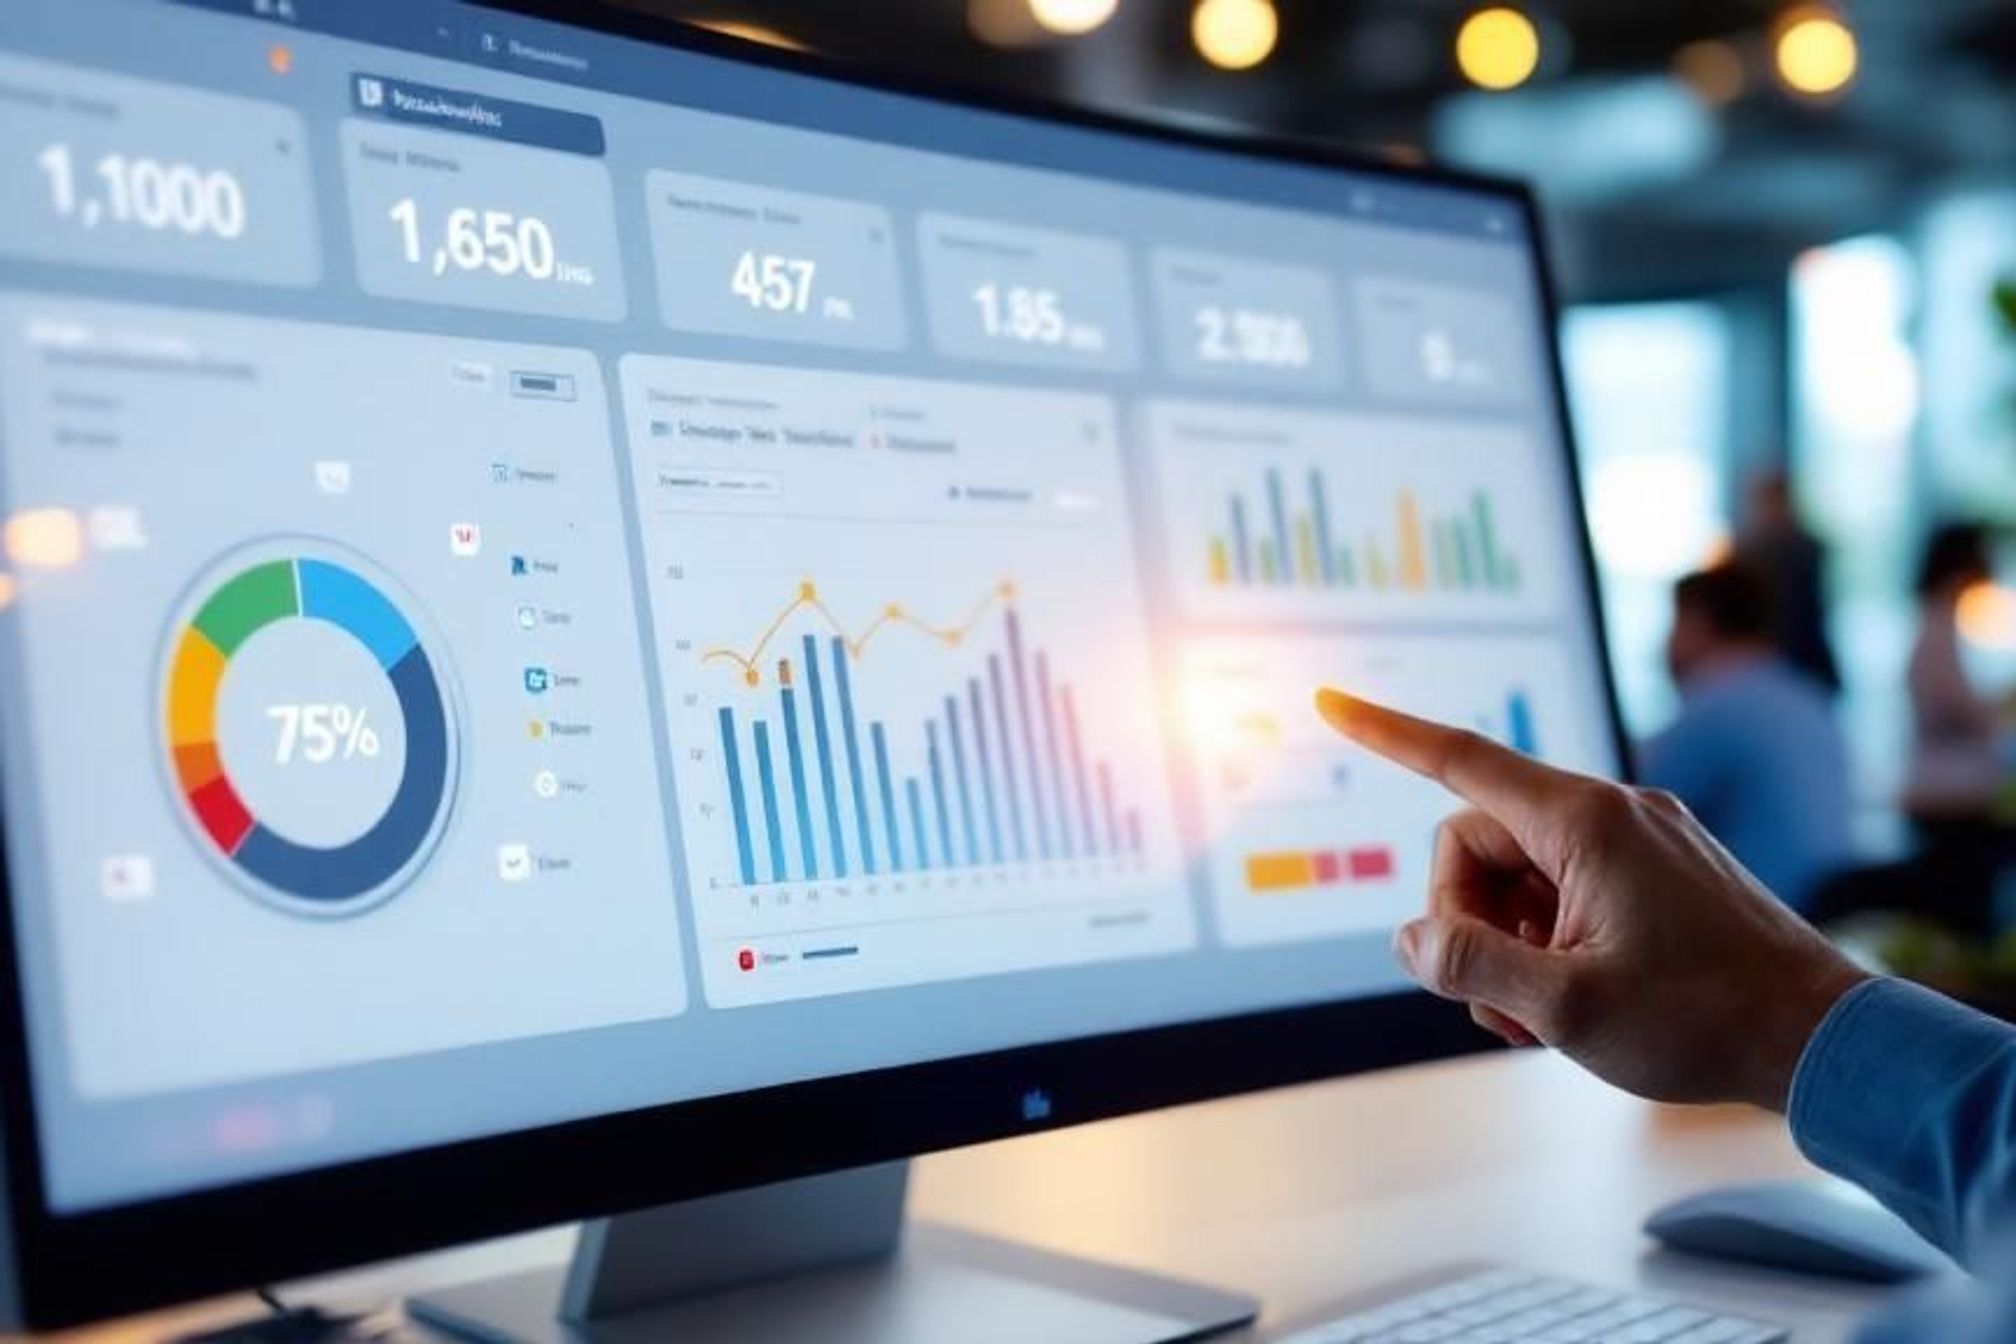
Think of your social media analytics dashboard as the cockpit of an airplane. A pilot relies on dozens of screens and dials to navigate safely through complex skies. In the same way, a social media marketer needs a central command center to make sense of the constant flow of data from different platforms. This turns what could be chaotic spreadsheets into a focused, decision-making tool. Without it, you're essentially flying blind.
Trying to track performance manually by pulling data from each social network one by one is a recipe for frustration. This old-school method is not only slow but also full of opportunities for human error, meaning you're often making decisions based on outdated information. A dedicated dashboard automates this work, giving you a real-time, complete picture of how you're doing.
From Data Points to Strategic Insights
The main job of a dashboard is to gather information from many places and present it in a way that’s easy to understand. It connects to your social accounts, pulls the raw data, and uses charts and graphs to tell a story about your performance.
This infographic breaks down how a social media analytics dashboard works, from the data sources to the final visuals.
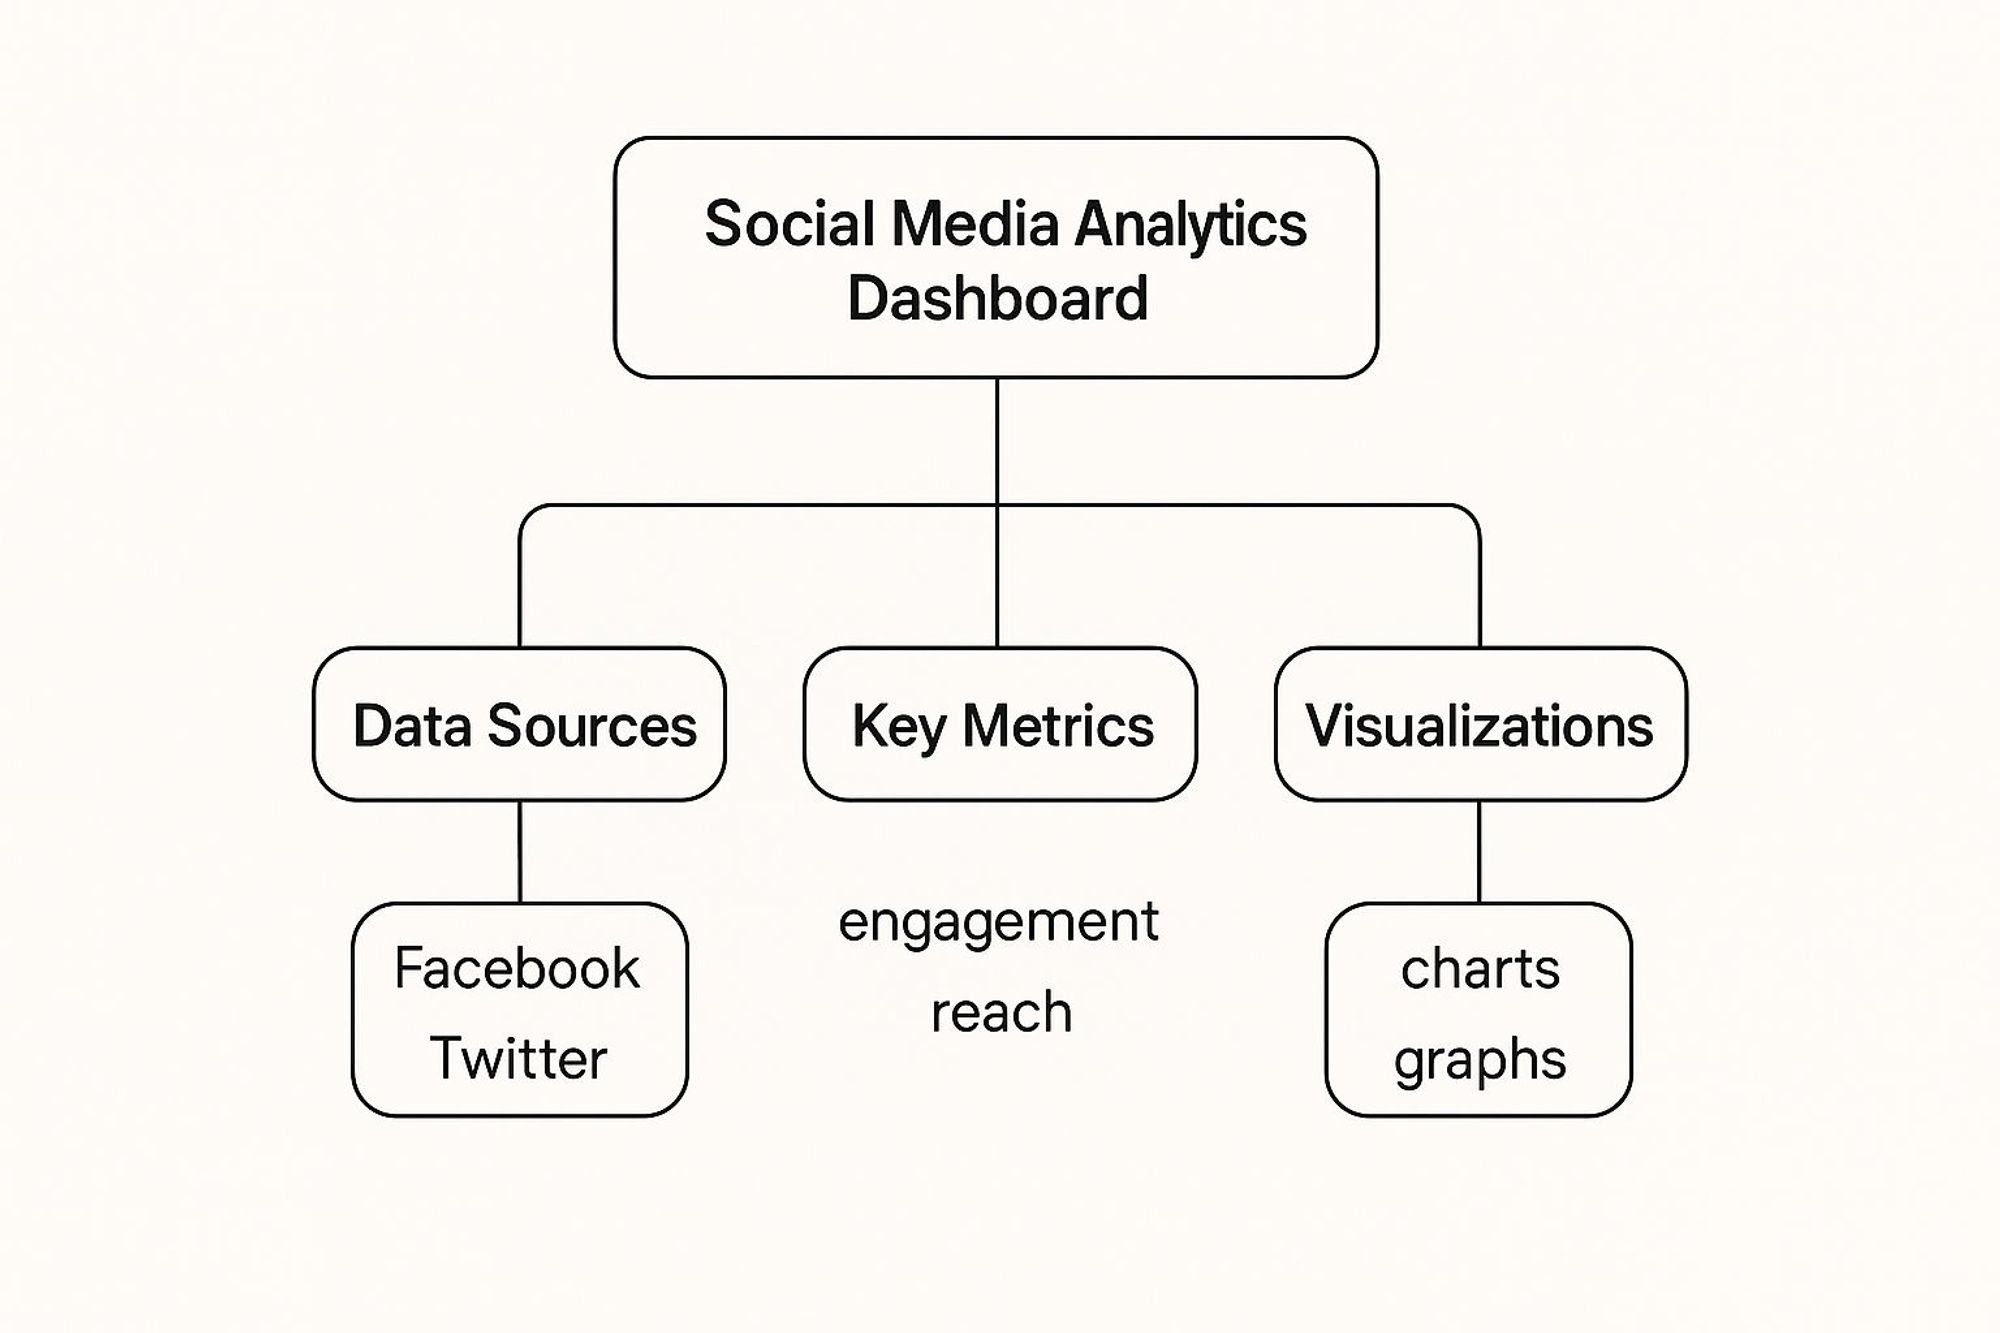
As the visual shows, a good dashboard is a bridge. It connects the raw data from platforms like Facebook and X to real business goals by organizing it into clear metrics and easy-to-read visuals. This process transforms abstract numbers into actionable insights.
For a more detailed walkthrough, this complete social media analytics dashboard guide provides helpful steps for getting your own dashboard set up and optimized.
Visualizing Your Performance
How your data is displayed is just as important as the data itself. A well-designed dashboard helps you spot the important signals and ignore the distracting noise, so you can focus on what really drives results. Your most critical metrics should be front and center, visible at a quick glance. You can explore this concept further in our guide to the best social media management tools.
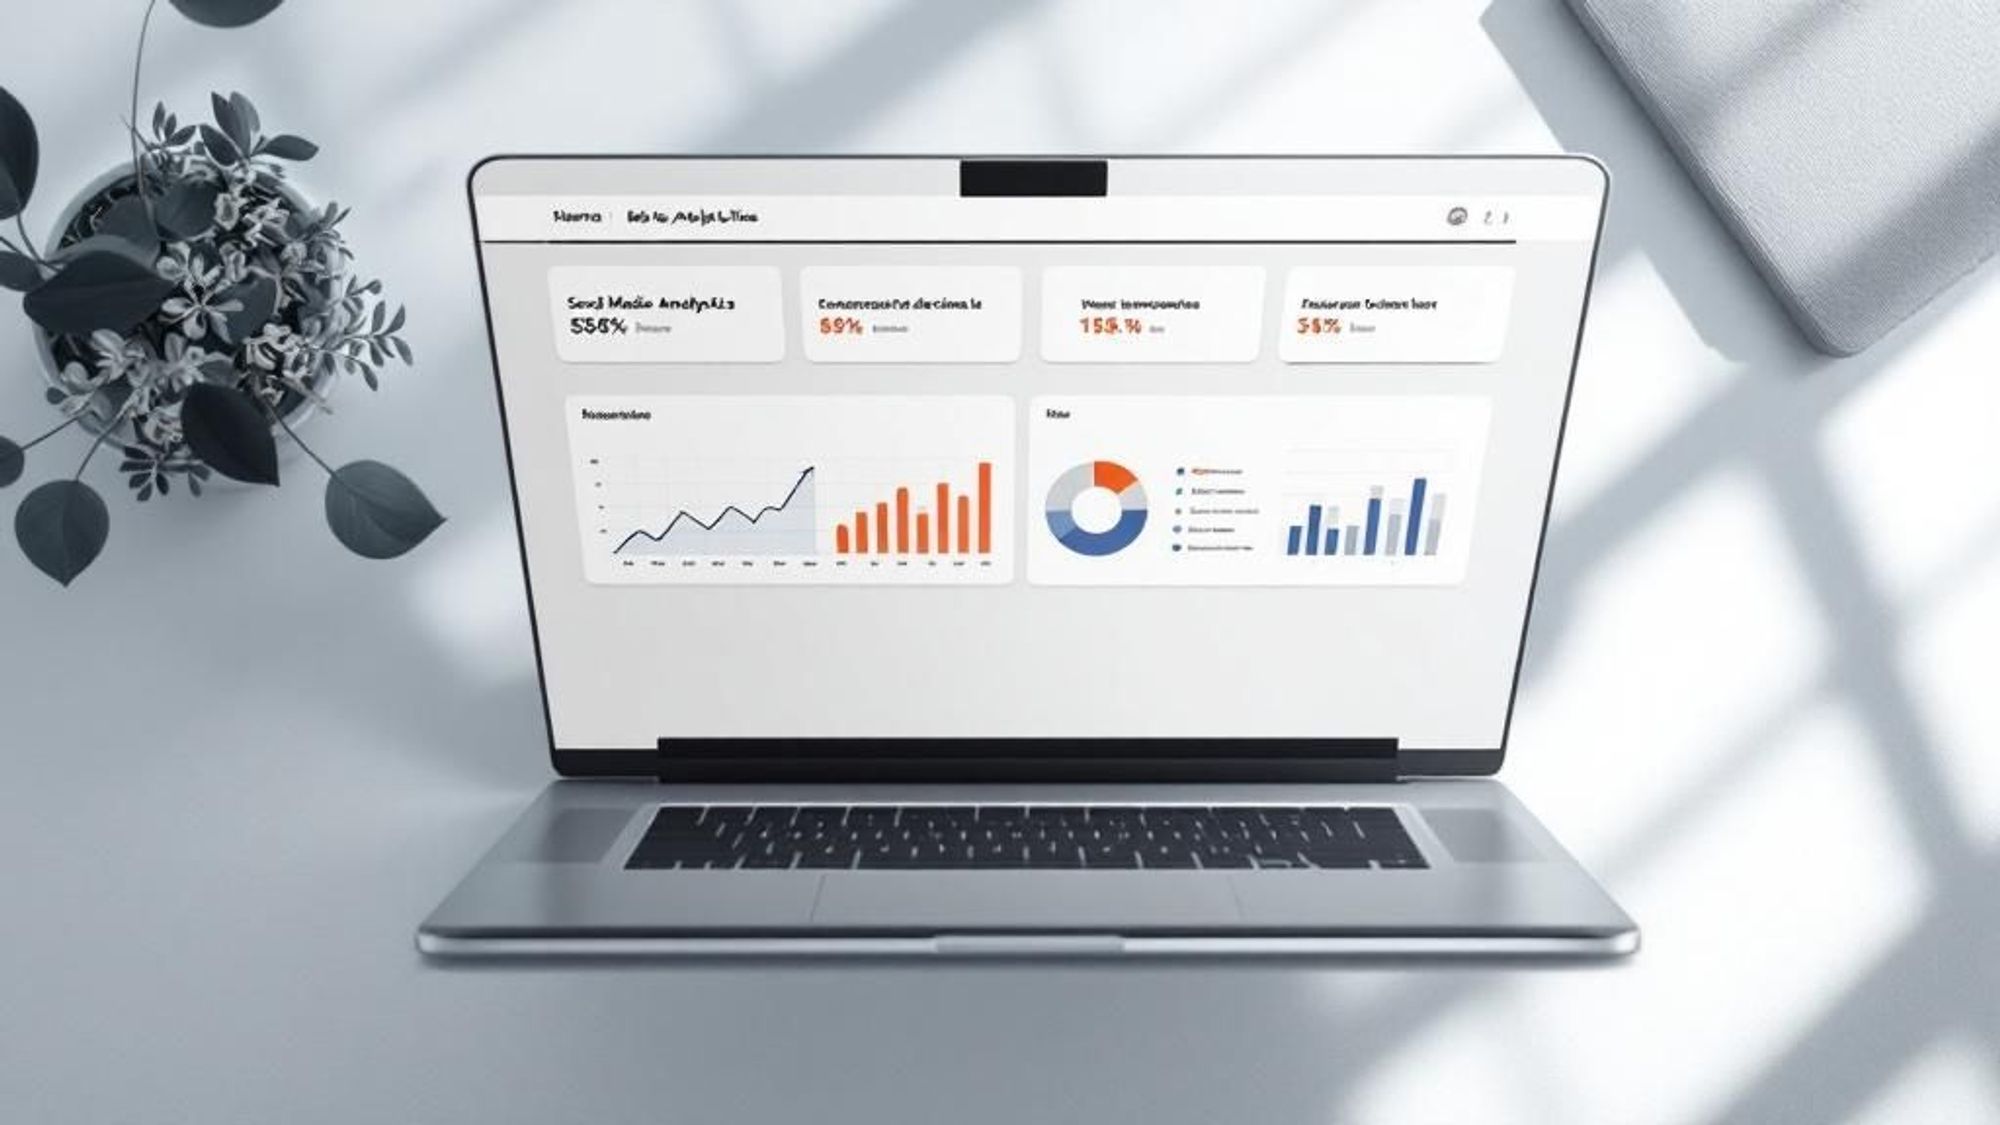
This screenshot is an example of what a professional analytics dashboard looks like, with its data organized into clean visualizations.
What makes this layout effective is the use of different widgets to track key performance indicators (KPIs)—like post engagement and audience growth—right next to each other. This setup allows for quick comparisons and makes it easy to identify trends as they happen. Structuring your own dashboard this way can help your team get the most out of your social media data.
The Analytics Revolution Changing Everything
Something big is happening in the world of social media analytics, and it goes far beyond just getting fancier charts. We're witnessing a major shift in how businesses understand their audiences and measure the real impact of their marketing efforts. This isn't just about plugging in new software; it's about adopting a data-first mindset that can reshape your entire marketing strategy.
A Market in Hyper-Growth
This change is driving incredible industry growth. The global social media analytics market, valued at USD 12.9 billion in 2024, is on track to soar past USD 81.5 billion by 2033. That's a compound annual growth rate of nearly 23.16%, a clear sign of how essential these tools have become. You can explore the complete projections in this detailed market size research report.
This isn't just money being thrown at a trend. It shows that companies are no longer treating social media as just a digital megaphone. Instead, they see it as a rich source of business intelligence, organizing teams and budgets around the insights they pull from a social media analytics dashboard.
Why This Matters for Your Business
The real story here isn't just the big numbers; it's about what this access to data means for businesses of all sizes. In practical terms, this analytics revolution brings several key advantages:
- Accessible Insights: What was once reserved for marketing giants with massive budgets is now available to smaller teams. Cloud-based tools have leveled the playing field, offering enterprise-grade analytics for a fraction of the cost.
- Smarter Decisions: Instead of guessing what works, marketers can now pinpoint which content truly connects with their audience. They can see which campaigns drive sales and where to put their ad spend for the best possible return.
- Proven Impact: A solid dashboard makes it simple to draw a direct line from social media activities to core business goals like generating leads and closing sales. This makes it much easier to justify marketing budgets to executives and stakeholders.
This shift is changing how we read digital signals. To stay ahead, it's worth learning about effective social media analytics reporting strategies that can turn data into decisions. The game is no longer about just counting likes; it's about understanding customer behavior in a meaningful way.
Metrics That Actually Move The Needle
A social media analytics dashboard can feel like trying to drink from a firehose. The sheer volume of data is immense, and it's easy to get lost in a sea of numbers. But here’s the secret: not all metrics are created equal. Some, like follower counts, are often just vanity metrics—they look impressive on the surface but don't actually tell you if you're reaching your business goals.
Think of it this way: vanity metrics are like the speedometer in a car stuck in traffic. It might flicker as you inch forward, but you aren't really going anywhere meaningful. Actionable metrics, on the other hand, are your GPS, showing your exact progress toward a specific destination. Your dashboard should be your GPS, not just a speedometer.
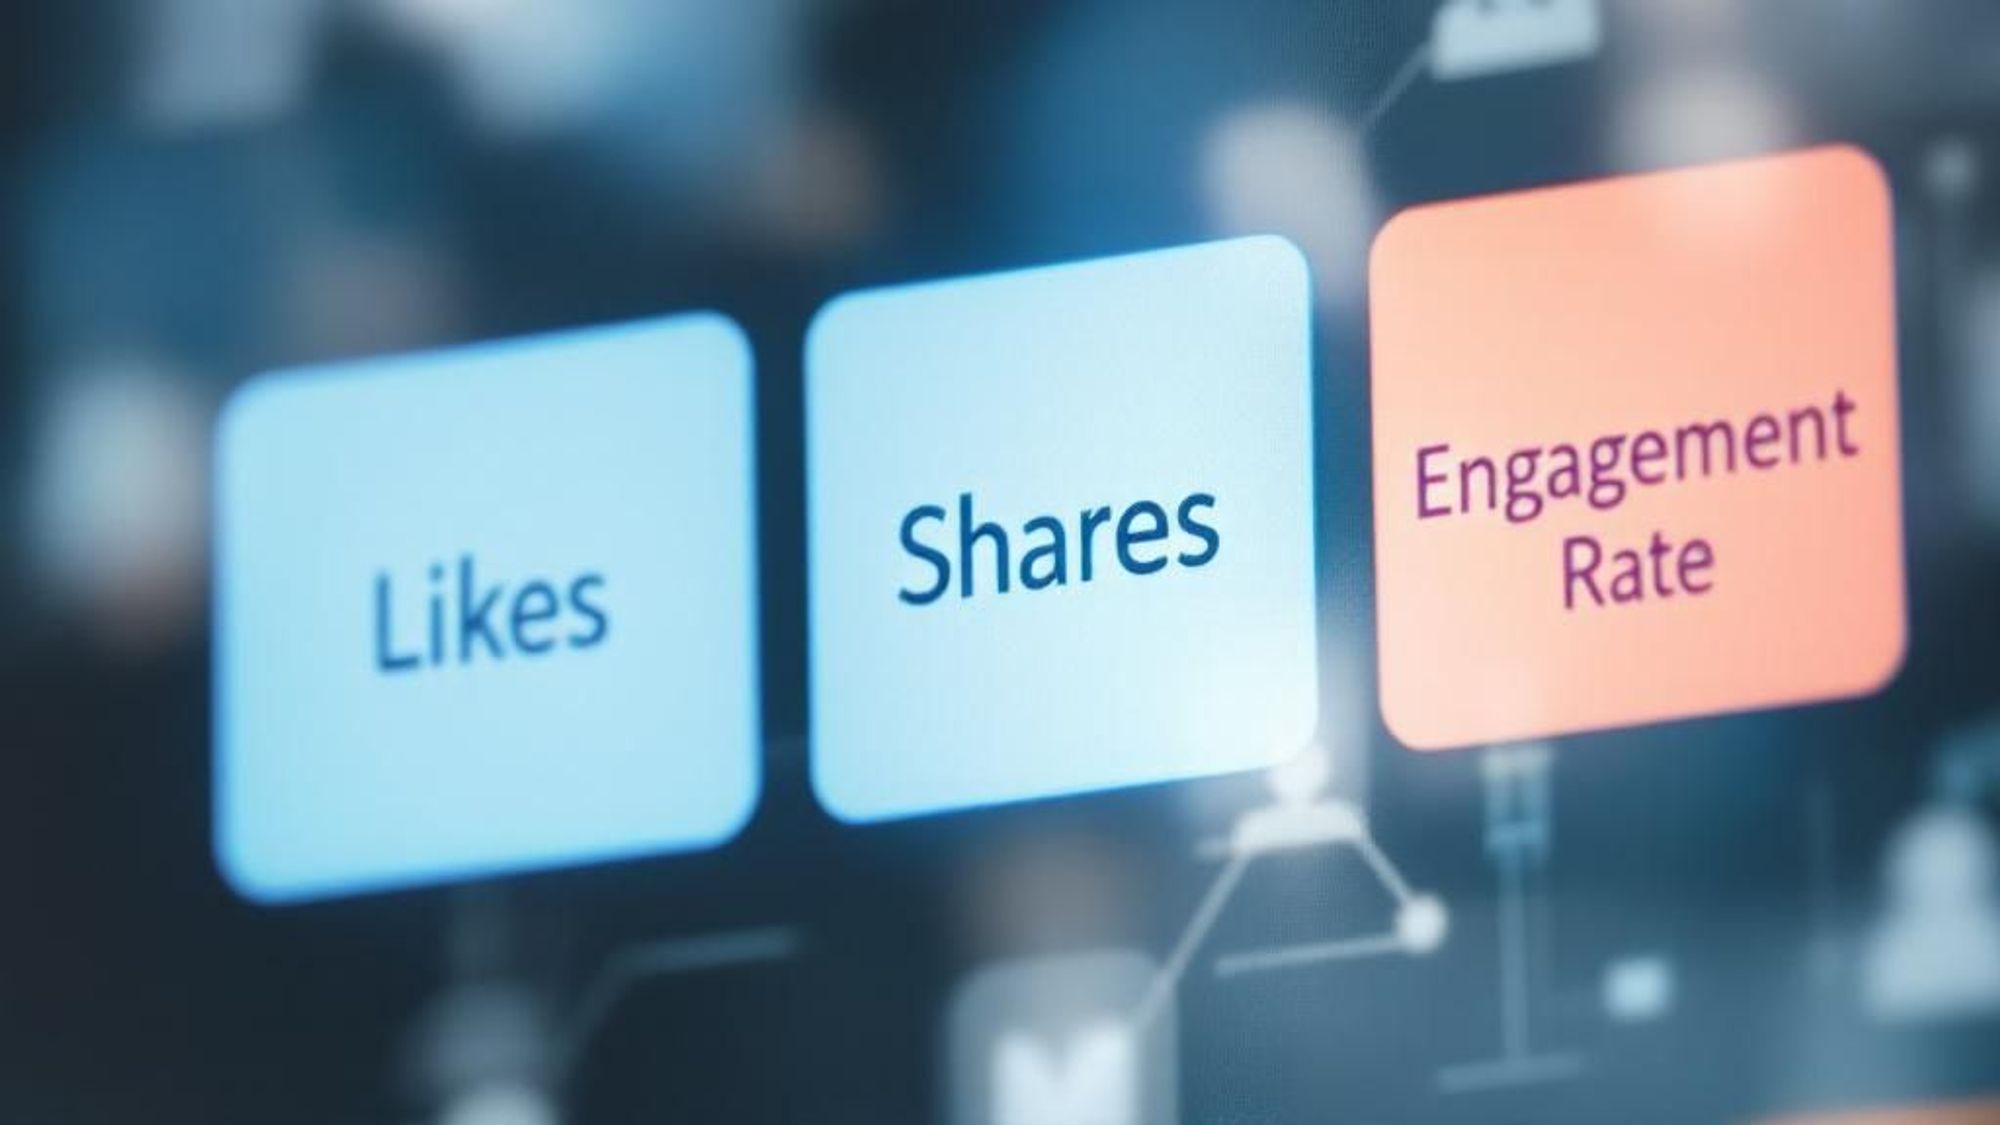
Moving Beyond Simple Engagement
Metrics like likes and shares are a decent starting point, but they only tell a fraction of the story. A high engagement rate is good, but it doesn't automatically translate to sales or loyal customers. To understand what’s truly working, you need to dig deeper into numbers that connect social media activity to tangible business outcomes. If you're looking for ways to improve these initial signals, our article provides some practical advice on how to boost social media engagement.
The real objective is to track metrics that have a clear link to revenue and customer acquisition. This means shifting your focus from surface-level interactions to data points that reflect genuine interest and purchase intent.
Core Metrics for Your Dashboard
To build a dashboard that tells a compelling story to stakeholders, you need to prioritize metrics that demonstrate clear business value. These can be grouped into categories that align with different stages of your customer's journey, from first discovering your brand to becoming a loyal advocate.
To help you focus on what really counts, here’s a breakdown of essential metrics, their business impact, and how often you should check them.
Essential Social Media Metrics Matrix
Key metrics organized by category with their business impact and measurement frequency
| Metric Category | Key Metrics | Business Impact | Measurement Frequency |
|---|---|---|---|
| Awareness | Reach, Impressions, Share of Voice | Measures how many unique users see your content and how your brand presence compares to competitors. | Weekly/Monthly |
| Consideration | Website Clicks, Click-Through Rate (CTR) | Shows how many people are interested enough to leave the social platform and learn more about your brand. | Weekly |
| Conversion | Leads Generated, Form Fills, Sales | Directly ties social media efforts to revenue by tracking how many users take a desired action (e.g., purchase, sign-up). | Daily/Weekly |
| Advocacy | Brand Mentions, User-Generated Content (UGC) | Indicates customer loyalty and organic promotion, which builds trust and extends your reach at no extra cost. | Weekly/Monthly |
By concentrating your social media analytics dashboard on these core areas, you shift from simply reporting on activity to demonstrating concrete ROI. This not only helps you refine your strategy but also proves the value of your social media efforts to the entire organization, justifying budgets and strategic decisions with hard data.
Turning Data Into Stories That Actually Matter
Raw data on its own is like a pile of uncooked ingredients—it has potential, but it isn't a meal. The real value of a social media analytics dashboard is its ability to be a master chef, turning those raw numbers into compelling stories that guide your strategy. Today's dashboards have moved far beyond simple bar charts to become storytelling tools that find hidden patterns and help you understand what's coming next.
Think of it this way: a basic chart might show you that a post received 1,000 likes. A story-driven dashboard, however, will show you that those likes came mostly from a new demographic, during a specific time of day, and after viewers watched the first three seconds of your video. This is the difference between knowing what happened and understanding why it happened, which is the key to creating repeatable success.
Designing Dashboards for Clarity
To turn data into a narrative, the design of your dashboard is critical. The goal isn't to cram every possible metric onto one screen. Instead, it's about arranging the data to answer specific business questions. An effective dashboard guides your eye from high-level summaries down to the finer details in a logical flow.
Here are a few practical techniques for presenting data clearly:
- Use the Right Chart for the Job: Line charts are perfect for showing trends over time (like follower growth). Bar charts are great for comparing separate categories (like engagement across different platforms). Use pie charts carefully—only for showing parts of a whole where the segments are few and distinct.
- Create Custom Views: Your CEO doesn't need to see the same level of detail as your community manager. Build different dashboard views for different people, focusing on the content performance metrics that matter most to their roles. You can explore this further in our detailed guide on content performance metrics.
- Add Context with Annotations: A sudden spike in traffic is just a mystery without an explanation. Use annotations on your charts to mark important events, like the launch of a new campaign or a competitor's big announcement.
The Rise of AI-Powered Visualization
Artificial intelligence is taking data storytelling to a new level. The market for dashboard and visualization tools is projected to grow at a compound annual growth rate of about 29.4% from 2025 to 2030. This growth is largely fueled by AI that can analyze sentiment, user behavior, and emerging trends. These smarter dashboards can automatically highlight insights you might have missed, essentially writing the story's key plot points for you. You can discover more insights about this market growth on Grand View Research to learn about this trend.
Next-Generation Analytics Transforming Marketing
The future of social media analytics is about much more than just counting likes and shares. We're moving into an age where technology can tell us not just what our audience does, but why they do it. This shift is turning the modern social media analytics dashboard from a simple reporting tool into a powerful engine for understanding human behavior online. The focus is now on deeper, more meaningful insights that shape real business strategies.
This evolution is reflected in the market's incredible growth. The social media analytics market is projected to jump from USD 13.83 billion in 2024 to USD 17.39 billion in 2025. That's a growth rate of about 25.7% in just one year. This surge is powered by new capabilities that are changing how marketers operate. You can read the full research about this market expansion to see the forces behind these numbers.
The New Frontiers of Social Analytics
So, what do these next-generation capabilities look like in the real world? They represent a huge leap forward in how brands can connect with their audiences and measure the true impact of their campaigns. Marketers who embrace these new tools are finding a major competitive edge.
Here are the key areas changing the game:
- Emotion and Behavioral Analytics: Imagine knowing the precise emotion behind a comment, not just whether it’s "positive" or "negative." New algorithms can analyze text, emojis, and even video cues to give you a much richer picture of how your audience feels. This helps brands tailor their responses and content with more empathy. For a closer look at this, check out our guide on improving community engagement on social media.
- Video and Visual Content Analysis: With platforms like TikTok, Instagram Reels, and YouTube Shorts filling up our feeds, analyzing visual content is essential. Modern dashboards can now track things like object recognition, scene changes, and where viewers lose interest in a video. This tells you exactly which visual elements grab attention and what makes people scroll away.
- Privacy-Compliant Tracking: As data privacy rules get stricter, getting deep insights while respecting user consent is critical. The newest analytics tools are built with privacy in mind, using anonymized and grouped data to spot trends without collecting personal information. This creates a sustainable way to do marketing that is both ethical and effective.
Building Dashboards That Drive Real Results
Creating a useful social media analytics dashboard is less about picking fancy colors and more about building a command center for your marketing decisions. A detailed dashboard that your team never looks at is just digital clutter. The real goal is to design a tool that solves actual business problems, encourages your team to use it, and leads to real improvements in your social media performance.

Think of it like the difference between a generic floor plan and a custom-designed home. The floor plan gives you a basic layout, but the custom home is built around the daily habits and needs of the people living there. Your dashboard should be built the same way—customized for your business goals, not based on generic templates. Staying aware of new tools, like the Mindstamp Insights Dashboard, can also help you build more effective analytics.
From Audit to Action: A Framework for Success
A results-focused dashboard starts long before you drag and drop your first chart. It begins with a clear picture of what you need to measure and why. Without this foundation, you risk creating a dashboard that looks great but offers little practical guidance.
This process breaks down into three important stages:
- Conduct a Thorough Analytics Audit: Before you build anything, take a hard look at what you’re currently tracking. What are the gaps between the data you have and the insights you need? This audit often reveals that teams are drowning in data but have no real direction. For example, you might be tracking follower count but have no clue which content actually turns followers into customers.
- Establish Clear, Aligned KPIs: Your key performance indicators (KPIs) must be directly tied to real business goals. If your main objective is to drive sales, your top KPI shouldn't be "likes"—it should be conversion rate or revenue generated from social media. Warren Talbot, Marketing Manager at Vans, emphasized this, stating that getting executive buy-in requires “hard facts, data and ROI,” which the right tools can provide.
- Design for User Engagement: A dashboard is only valuable if your team actually uses it. Design the layout with them in mind. Create different views for different roles—your social media manager needs detailed post-level data, while your CEO just needs a high-level summary of ROI. This ensures everyone gets the information they need without feeling overwhelmed. As you design, knowing platform specifics is vital; for more details, check out our guide on Threads analytics.
Overcoming Common Implementation Pitfalls
Even with a great plan, building your dashboard can have its challenges. One of the biggest obstacles is data silos, where information from different social platforms is stuck in separate systems. Bringing all this data together into one place is essential for getting a complete picture of your performance.
Another common issue is ensuring data quality. Inaccurate or messy data leads to bad analysis and even worse decisions. While setting up automated reports can save a lot of time and prevent human error, it's important to periodically check that the data being pulled is correct.
By focusing on a clean, connected, and user-friendly design, your social media analytics dashboard can grow from a simple report into a powerful tool that actively drives your business forward.
Success Stories From The Analytics Trenches
Theory is one thing, but the real test of a social media analytics dashboard is how it performs in the wild. Marketing teams in various industries are using these tools to get impressive results that directly impact their bottom line. By examining how they use data, we can turn abstract ideas into practical, repeatable strategies.
Turning Clicks Into Customers
For e-commerce brands, a dashboard is more than a reporting tool—it’s a roadmap for turning browsers into buyers. Take an online fashion retailer, for example. They noticed a high click-through rate on their Instagram ads but a frustratingly low conversion rate on their website. By digging into their dashboard, they discovered that users coming from Instagram were overwhelmingly abandoning their carts at the payment stage.
This single insight led them to add more payment options, like Apple Pay and Klarna, to their checkout process. The outcome was a 15% reduction in cart abandonment and a major drop in customer acquisition costs. They didn't need more traffic; they just needed to remove the friction point that their data had clearly pointed out.
This screenshot shows a common dashboard view that helps teams visualize how their content is doing across different social networks.
The key lesson here is the power of comparing performance side-by-side. It helps you quickly spot which channels are great for engagement and which ones are actually driving valuable link clicks.
Demonstrating Clear ROI for Agencies
Agencies thrive on their ability to prove their worth to clients. A solid analytics dashboard is their secret weapon for showing a clear return on investment. Imagine a digital marketing agency managing accounts for several local restaurants. They used a shared dashboard to show each client exactly how social media campaigns were translating into online reservations.
They focused on tracking metrics like:
- Reach on promotional posts.
- Click-through rates on reservation links.
- Cost per reservation from their paid social ads.
By telling a clear, data-driven story, the agency successfully renewed contracts with 90% of its clients. The dashboard didn't just report on fluffy metrics; it proved tangible business value in a language every restaurant owner understood. It turned abstract "engagement" into real customers sitting in their dining rooms.
Ready to turn your social data into business growth? The Schedul dashboard gives you the clarity to track what matters and make decisions that drive real results. Explore Schedul today and build your own success story.
No credit card required!