Thursday, July 3, 2025
7 Key Brand Health Metrics to Track in 2025


In a digital landscape crowded with vanity metrics, understanding your brand's true standing with your audience is paramount. While social media numbers offer a snapshot, they don't tell the whole story. This is where brand health metrics come in. These powerful indicators provide a holistic view of how your target audience perceives, feels about, and interacts with your brand over time. They are the diagnostic tools that help you move beyond surface-level data to accurately gauge customer loyalty, market position, and long-term viability.
A strong brand can command premium prices, weather market downturns, and foster a loyal community that advocates on its behalf. Neglecting these core measurements is like flying a plane without an instrument panel; you might be moving, but you don't know if it's in the right direction. Tracking the right data ensures your strategic decisions are based on solid evidence, not just gut feelings or fluctuating engagement numbers.
In this guide, we'll break down the seven most critical brand health metrics you need to be tracking. We will explore not just what they are, but how to measure them, what benchmarks to aim for, and how to use modern tools to integrate this tracking into your daily workflow. This will ensure your brand isn't just surviving, but actively thriving.
1. Brand Awareness
Brand awareness is the foundational metric of brand health, measuring how familiar your target audience is with your brand. Think of it as your brand's "mental real estate" in the minds of consumers. Without awareness, other metrics like consideration, preference, and loyalty are impossible to build. It's the essential first step in the customer journey, indicating your overall market presence and initial reach.
This metric is typically broken down into two key categories:
- Unaided Awareness: This is the gold standard, where consumers recall your brand spontaneously without any prompts. For example, if asked to name a soft drink, a respondent who says "Coca-Cola" demonstrates unaided awareness.
- Aided Awareness: This measures brand recognition when a consumer is given a list of brands or a visual cue. For instance, showing someone the Nike "swoosh" and asking if they recognize the brand is a measure of aided awareness.
How to Measure and Track Brand Awareness
Direct measurement often requires market research through surveys, focus groups, or brand tracking studies. However, you can also use digital proxies to gauge awareness trends. Monitoring metrics like Direct Traffic to your website (users who type your URL directly) and Share of Voice (SOV) in online conversations provides valuable insight. An increase in brand name searches on Google Trends or social media mentions can also signal growing awareness. For a deeper dive into platform-specific data, you can learn more about using X analytics for brand insights, which can help track mentions and engagement.
The infographic below summarizes the core awareness metrics you should be tracking.
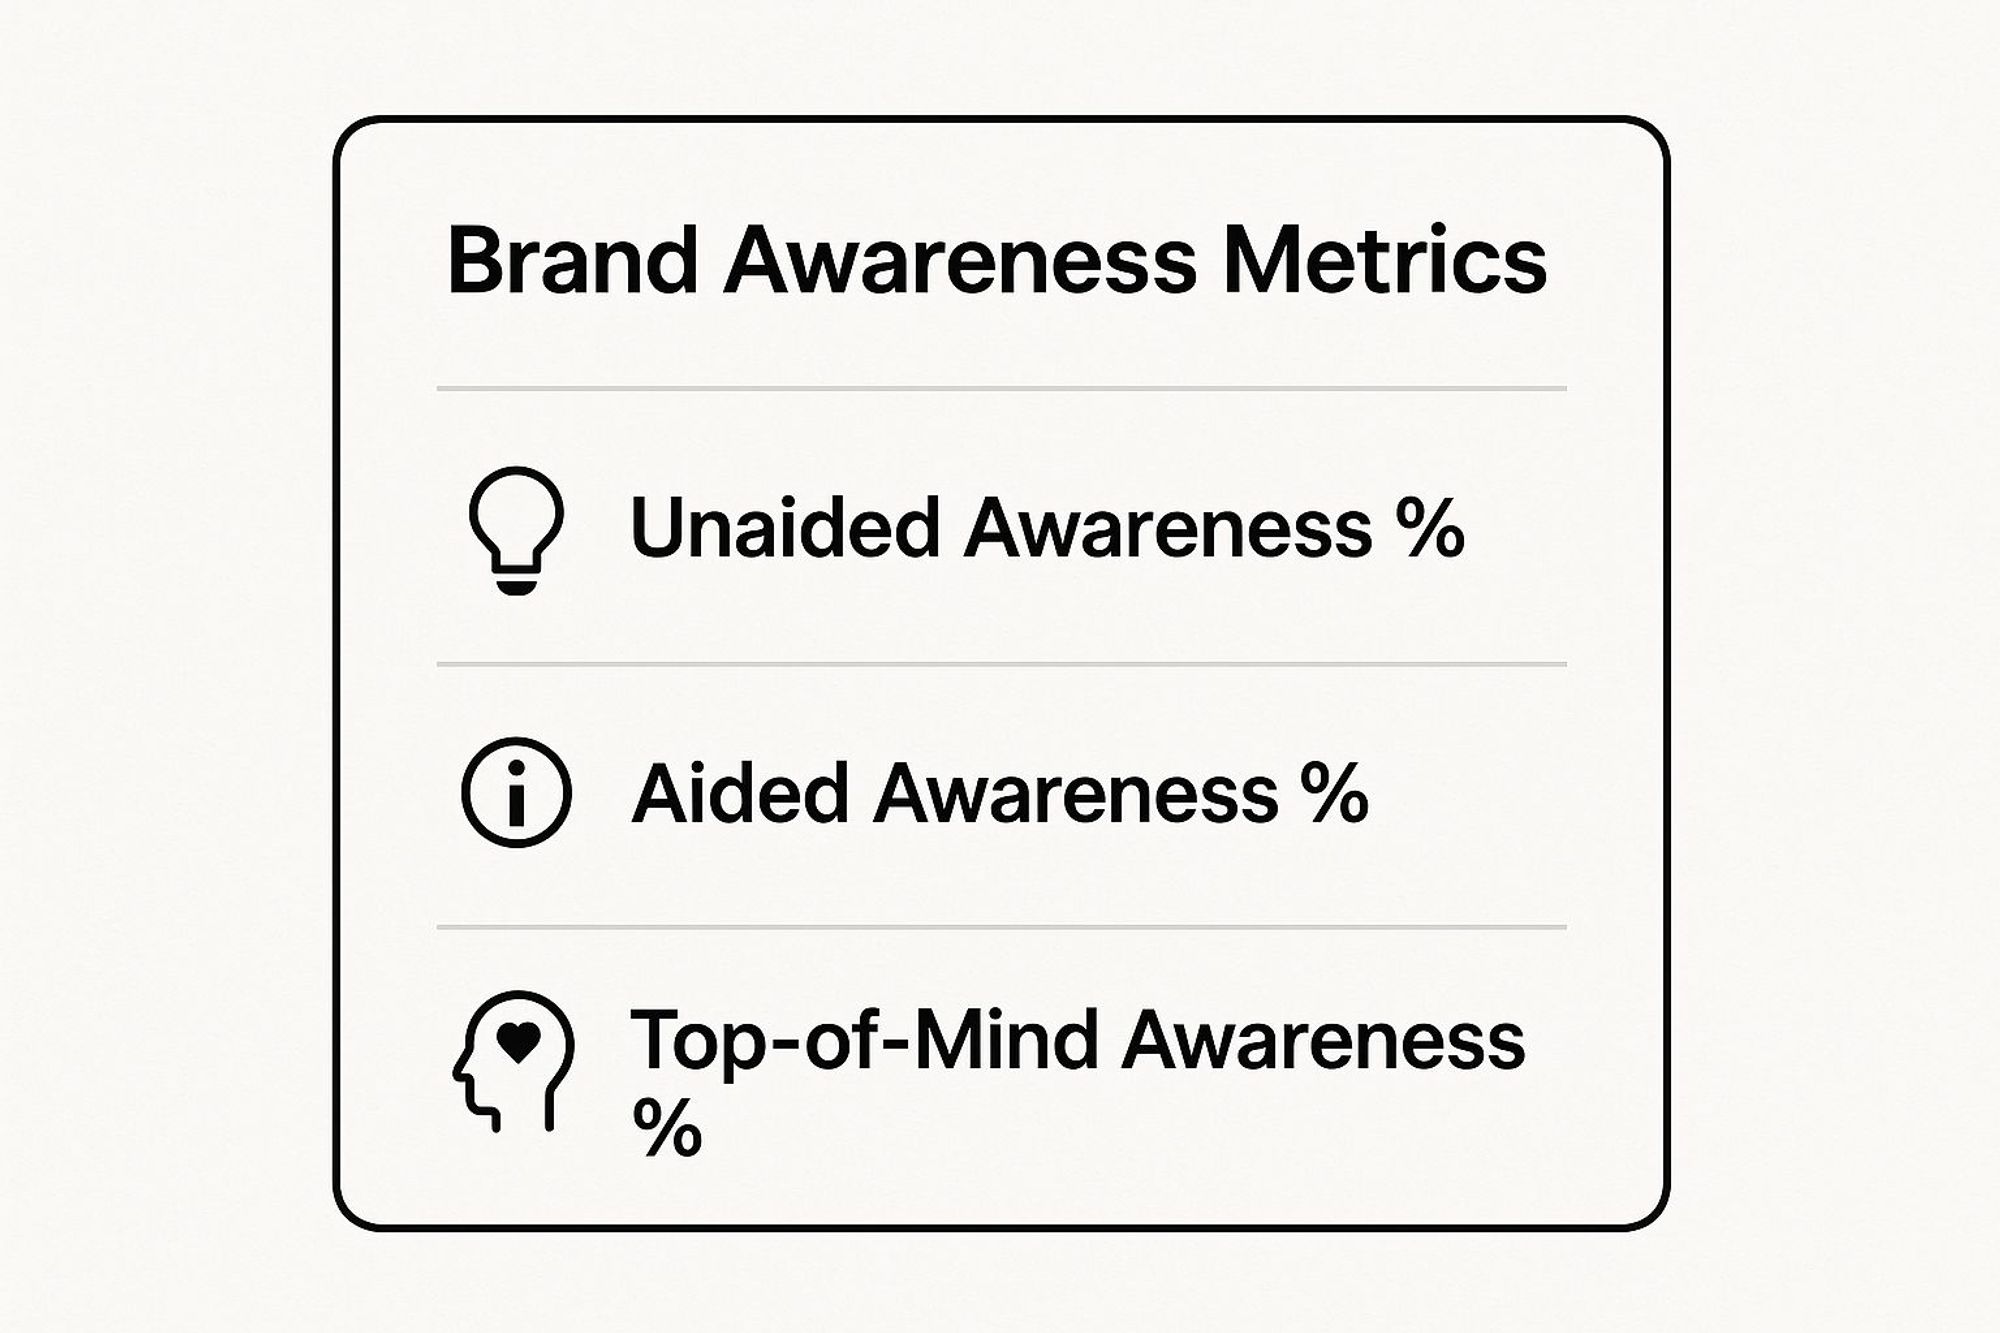
Tracking these three distinct awareness levels provides a comprehensive view, from simple recognition to being the first brand that comes to a consumer's mind. For a complete picture, regularly benchmark your awareness scores against 3-5 key competitors and analyze the data across different demographic segments to identify your strongest and weakest audience groups.
2. Net Promoter Score (NPS)
Net Promoter Score (NPS) is a powerful brand health metric that directly measures customer loyalty and their willingness to advocate for your brand. Developed by Fred Reichheld and Bain & Company, it hinges on a single, powerful question: "On a scale of 0-10, how likely are you to recommend our brand/product/service to a friend or colleague?" The simplicity of NPS is its strength, offering a clear, quantifiable score that reflects customer sentiment and predicts business growth.
Based on their response, customers are categorized into three distinct groups:
- Promoters (Score 9-10): These are your most enthusiastic and loyal customers. They are brand advocates who actively recommend you, fueling viral growth and positive word-of-mouth.
- Passives (Score 7-8): These customers are satisfied but unenthusiastic. They are vulnerable to competitive offers and are not actively promoting your brand.
- Detractors (Score 0-6): These are unhappy customers who can damage your brand's reputation through negative reviews and word-of-mouth, potentially harming growth.
How to Measure and Track Net Promoter Score
The NPS score itself is calculated by subtracting the percentage of Detractors from the percentage of Promoters (% Promoters - % Detractors). This yields a score ranging from -100 (everyone is a Detractor) to +100 (everyone is a Promoter). For example, Apple consistently achieves an NPS above 70, showcasing exceptional brand loyalty. To effectively use NPS as one of your core brand health metrics, always include an open-ended follow-up question like, "What is the primary reason for your score?" This qualitative feedback is where the most valuable insights are found.
You can deploy NPS surveys at various points in the customer journey. A Relational NPS is sent out periodically (e.g., quarterly) to gauge overall brand loyalty, while a Transactional NPS is sent immediately after a specific interaction, like a customer support call or a purchase, to measure satisfaction with that touchpoint. It is critical to "close the loop" by responding to feedback, especially from Detractors, within 24-48 hours to resolve their issues and show you value their input. This practice can turn a negative experience into a positive one and prevent customer churn.
3. Brand Equity
Brand equity is one of the most vital brand health metrics because it directly translates brand perception into tangible financial value. It represents the commercial worth a brand adds to a product or service beyond its functional benefits. This value is reflected in the premium customers are willing to pay, their emotional connection to the brand, and the overall strength of its market influence. A brand with high equity, like Apple or Nike, can command higher prices, enjoy greater customer loyalty, and navigate market challenges more effectively.
This powerful metric is typically understood through several key dimensions:
- Financial Value: This is the most direct measure, often calculated by firms like Interbrand, which valued Apple's brand at over $400 billion. It quantifies the brand as a financial asset.
- Price Premium: This measures how much more customers are willing to pay for your product versus a generic or competing alternative. For example, Starbucks can charge significantly more for coffee than a local café due to its strong brand equity.
- Brand Associations: This refers to the thoughts, feelings, and perceptions that come to mind when a consumer thinks of your brand. Positive associations (e.g., "innovation" for Tesla, "safety" for Volvo) are a core component of high equity.
How to Measure and Track Brand Equity
Measuring brand equity requires a multi-faceted approach, combining financial analysis with consumer research. While you can hire specialized firms for a formal valuation, you can also track leading indicators using internal and external data. Monitor your Price Premium by comparing your average selling price to key competitors quarterly. Use consumer surveys to track Brand Associations and perceived quality over time.
A strong brand positioning framework is fundamental to building and measuring equity. To build a brand that commands this kind of value, you must first define its unique place in the market. You can discover how a brand positioning framework builds equity and use it as your strategic foundation for tracking these metrics.
Key Insight: Brand equity isn't just about perception; it's a measurable asset that directly impacts your bottom line. Tracking the price premium your brand can command against unbranded alternatives is one of the most straightforward ways to gauge its strength.
Regularly benchmark your brand's perceived value and price elasticity against both direct competitors and category leaders. Combining this with surveys that gauge consumer preference and loyalty will provide a holistic view of your brand's equity, giving you a powerful metric to report on its overall health and financial contribution.
4. Customer Satisfaction (CSAT)
Customer Satisfaction (CSAT) is a direct measure of how well your brand's products, services, and overall experience meet or surpass customer expectations. It provides immediate, transactional feedback, serving as a critical leading indicator for customer retention, loyalty, and brand advocacy. A high CSAT score shows that your core offering is resonating with your audience and fulfilling its promise, which is fundamental to long-term brand health.
This metric is typically captured through a simple, direct question following a key interaction, such as a purchase or a customer support call: "How satisfied were you with your experience?" The response is usually recorded on a numerical scale.
- Common Scales: The most frequently used scales are 1-5 (Very Unsatisfied to Very Satisfied) or 1-10. The final CSAT score is calculated as the percentage of "satisfied" respondents (those who chose 4 or 5 on a 5-point scale, for example).
- Transactional Focus: CSAT is powerful because it links feedback to specific touchpoints, allowing you to pinpoint exactly what is working and what isn't in the customer journey. Brands like Zappos and Ritz-Carlton built their reputations by obsessively monitoring and acting on this feedback to deliver exceptional service.
How to Measure and Track Customer Satisfaction
The most effective way to measure CSAT is through direct, timely surveys deployed at critical moments. You can use email, in-app pop-ups, or SMS to ask for feedback immediately after a purchase, a product delivery, or a support interaction. This ensures the experience is fresh in the customer's mind, yielding more accurate data.
To effectively integrate CSAT into your brand health metrics, it's crucial to go beyond just the overall score. Segmenting results by customer demographics, purchase history, or interaction type can reveal deeper insights. For example, you might find that while your overall CSAT is high, satisfaction with your mobile app checkout process is lagging. Focusing on improving your lowest scores first often yields the most significant impact on overall brand perception and retention. This granular feedback loop is also a key component of fostering a strong online community, as satisfied customers are more likely to become active participants. You can explore how positive experiences fuel brand loyalty and learn more about social media community engagement here.
5. Share of Voice (SOV)
Share of Voice (SOV) is a comparative brand health metric that quantifies your brand's presence within the market conversation relative to your competitors. It's not just about how many people know you, but how much of the relevant conversation you own. A high SOV indicates strong market mindshare and can often correlate with market share, making it a critical indicator of competitive dominance and brand visibility.
This metric has evolved beyond its traditional advertising roots and now encompasses a wide digital footprint:
- Social SOV: Measures your brand's mentions on social media platforms compared to the total mentions for all competing brands in your industry.
- Search SOV: Gauges your brand's visibility in paid and organic search results for key industry terms. This includes both your share of impressions on paid ads and your ranking for important keywords.
How to Measure and Track Share of Voice
Measuring SOV requires a comprehensive competitive analysis. It involves aggregating all mentions of your brand across various channels (social media, blogs, news sites, forums, search engines) during a specific period and dividing that by the total mentions for all brands in your competitive set. For example, if your brand was mentioned 200 times and your three main competitors were mentioned a combined 800 times, your SOV would be 20% (200 / 1000).
You can effectively track this using dedicated brand monitoring or social listening tools. For instance, Tesla historically achieves an extremely high SOV through earned media and PR, far outpacing competitors who rely heavily on paid advertising. Similarly, Nike's SOV surged by 15% following its Colin Kaepernick campaign, demonstrating how a single, impactful initiative can dominate the industry conversation. For a closer look at the tools that can automate this process, you can explore various options to simplify your analysis and get real-time insights into your competitive landscape. Learn more about the best tools for social media competitor analysis to find the right fit for your needs.
Tracking SOV helps you benchmark your visibility against rivals and understand the impact of your marketing campaigns. Aim to correlate shifts in your SOV with key business outcomes like website traffic, lead generation, and sales to prove its strategic value.
6. Brand Sentiment
Brand sentiment moves beyond simple awareness to analyze the emotional tone behind conversations about your brand. It categorizes online mentions as positive, negative, or neutral, offering a qualitative layer to your brand health metrics. This insight is crucial for understanding public perception, identifying potential crises before they escalate, and gauging the impact of your marketing campaigns and corporate actions on consumer emotions.

Simply knowing people are talking about you isn't enough; you need to know how they feel. For example, Patagonia’s environmental activism consistently drives over 90% positive sentiment in related conversations, reinforcing its brand values. Conversely, an airline might track sentiment recovery after a PR incident to measure the effectiveness of its response strategy. A healthy brand consistently maintains a high ratio of positive to negative mentions.
How to Measure and Track Brand Sentiment
Tracking brand sentiment requires specialized tools that use Natural Language Processing (NLP) and AI to analyze text from social media, review sites, forums, and news articles. These platforms assign a sentiment score to each mention, which can then be aggregated to see the bigger picture. To get started, you can explore various social media monitoring tools that help you track brand sentiment and automate this complex process.
For the most accurate analysis, consider these best practices:
- Combine AI with Human Validation: While AI is powerful, it can miss sarcasm, slang, or context. Periodically have a human team member review a sample of mentions to validate the AI's accuracy and refine its rules.
- Track Sentiment by Attribute: Don't just track overall sentiment. Segment analysis by key attributes like "customer service," "product quality," or "price" to pinpoint specific strengths and weaknesses.
- Monitor Trends, Not Just Scores: A single sentiment score is a snapshot. The real insight comes from tracking trends over time. A sudden dip in positive sentiment can be an early warning sign of an emerging issue that needs immediate attention.
- Respond to Negative Spikes: Actively monitor for and quickly respond to spikes in negative sentiment. A swift and empathetic response can mitigate damage and, in some cases, turn a negative experience into a positive one.
7. Brand Consideration
Brand consideration is the critical bridge between awareness and action, measuring the likelihood that consumers will include your brand in their decision-making process when looking to make a purchase. It sits squarely in the middle of the marketing funnel, acting as a vital indicator of whether your brand awareness efforts are successfully translating into genuine purchase interest. A consumer might be aware of your brand, but if they don't consider it when shopping, that awareness has limited value.
This metric helps you understand if your brand has earned a spot in what is known as the consumer's "consideration set." This is the small group of brands a buyer seriously evaluates before making a final choice.
- Example 1: In the highly competitive midsize sedan market, Toyota has consistently maintained a consideration rate of around 45%, meaning nearly half of potential buyers in the category will include a Toyota model in their evaluation.
- Example 2: Through strategic marketing and product innovation, Samsung successfully increased its smartphone consideration among North American consumers from 12% to over 28% in just a few years, directly challenging established leaders.
- Example 3: In the travel industry, Airbnb grew its consideration against traditional hotels from just 5% to over 35% among leisure travelers by highlighting unique experiences and value.
How to Measure and Track Brand Consideration
Directly measuring brand consideration requires asking consumers specific questions through brand tracking surveys. Questions like, "Which of the following brands would you consider purchasing for your next smartphone?" or "When thinking about [product category], which brands come to mind as options?" provide quantifiable data. Tracking this over time reveals the effectiveness of your marketing campaigns in moving consumers down the funnel.
You can also use digital behavior as a proxy. Monitoring metrics like website engagement (e.g., time on product pages, use of a "compare" feature) and high-intent keyword searches (e.g., "[Your Brand] vs. [Competitor Brand]") offers clues about consideration levels. A rise in branded searches that include comparison terms is a strong signal of active evaluation.
To effectively track this crucial brand health metric, focus on the following:
- Measure by Purchase Occasion: A consumer might consider your brand for a daily purchase but not for a special occasion. Segment your surveys to understand these nuances.
- Track Consideration Set Composition: It’s not just about getting into the set; it’s about who else is in there with you. Analyze which competitors you are most frequently considered alongside.
- Identify Barriers: Use survey questions to ask why consumers are not considering your brand. Common barriers include price, perceived quality, lack of features, or poor past experiences.
- Correlate with Purchase Data: The ultimate goal is to link an increase in consideration to an increase in sales. Analyze how your consideration scores trend with actual purchase data to prove marketing ROI.
Brand Health Metrics Comparison Table
| Metric | Implementation Complexity 🔄 | Resource Requirements ⚡ | Expected Outcomes 📊 | Ideal Use Cases 💡 | Key Advantages ⭐ |
|---|---|---|---|---|---|
| Brand Awareness | Moderate; requires surveys and tracking over time | Medium to High; needs sampling and analysis | Measures brand recognition and market presence | Tracking brand visibility and competitive positioning | Strong predictor of purchase consideration; benchmarkable |
| Net Promoter Score (NPS) | Low; single-question survey | Low; easy to deploy | Measures customer loyalty and advocacy | Customer satisfaction and loyalty programs | Simple, widely understood, correlates with growth |
| Brand Equity | High; combines financial and perceptual measurement models | High; requires extensive data and modeling | Links brand perception with financial performance | Strategic brand investment and portfolio management | Demonstrates marketing ROI; guides strategic decisions |
| Customer Satisfaction (CSAT) | Low to Moderate; surveys post-interaction | Low to Medium; easy to implement | Direct feedback on customer experience quality | Operational improvements and retention tracking | Easy to measure; actionable insights; correlates with retention |
| Share of Voice (SOV) | Moderate to High; requires multi-channel media monitoring | Medium to High; needs sophisticated tools | Measures brand visibility and competitive share | Media investment optimization and competitive benchmarking | Comprehensive brand visibility; early indicator of shifts |
| Brand Sentiment | Moderate; requires AI tools and human validation | Medium; ongoing monitoring and analysis | Real-time monitoring of public perception and emotional tone | Reputation management and crisis prevention | Early warning system; insight into brand strengths/weakness |
| Brand Consideration | Moderate; requires surveys and funnel analysis | Medium; data from purchase intent and market research | Tracks likelihood of brand inclusion in purchase decisions | Marketing funnel optimization and conversion enhancement | Strong predictor of market share; identifies barriers |
Integrating Your Metrics: From Data Points to Brand Strategy
Navigating the landscape of brand health requires more than just collecting isolated data points. While individually powerful, metrics like Brand Awareness, Net Promoter Score (NPS), and Share of Voice (SOV) reveal their true strategic value when woven together into a coherent narrative. The real art lies in understanding the intricate dance between these figures. A sudden spike in negative Brand Sentiment, for example, is often a leading indicator of a future dip in NPS or Customer Satisfaction (CSAT).
The goal is to move beyond passive measurement and into active, strategic management. Think of your brand health metrics not as a report card, but as a real-time GPS guiding your every move. By treating these seven key indicators as an interconnected ecosystem, you gain a panoramic view of your brand’s position in the market and in the minds of your audience.
Building a Cohesive Brand Health Dashboard
The most effective way to harness this power is by creating a centralized dashboard. This command center should integrate data from disparate sources, allowing you to see the cause-and-effect relationships playing out.
- Connect Social and Survey Data: Combine the qualitative insights from Brand Sentiment analysis on social media with the quantitative scores from your NPS and CSAT surveys. This pairing gives you the "what" and the "why" behind customer feelings.
- Link SOV to Awareness and Consideration: Track how your Share of Voice efforts translate into tangible gains in Brand Awareness and, ultimately, Brand Consideration. If SOV increases but consideration stagnates, it signals a need to refine your messaging or targeting.
- Monitor Brand Equity Over Time: Brand Equity is the long-term prize. View it as the cumulative result of consistently positive performance across all other metrics. A strong, positive sentiment and high customer satisfaction are the building blocks of enduring equity.
Once you've collected your brand health metrics, the next crucial step is integrating them into a cohesive strategy. Understanding how a hotel KPI dashboard can optimize operations illustrates the power of data-driven decision-making, where multiple indicators are unified to guide performance and resource allocation. This same principle of integrated analytics is fundamental to building a resilient brand.
From Insights to Actionable Strategy
Mastering these brand health metrics empowers you to be proactive rather than reactive. Instead of guessing what your audience wants, you'll have a data-backed roadmap to inform your content strategy, guide product development, and refine your customer service approach. This strategic clarity is what separates thriving brands from those that merely survive.
Begin by establishing clear benchmarks for each metric. Set realistic, incremental goals for improvement and, most importantly, assign ownership within your team for tracking and acting upon the insights. Consistent monitoring and an agile mindset will ensure your brand not only weathers market shifts but emerges stronger, more respected, and deeply connected with the community it serves.
Ready to take control of your brand's narrative? Schedul provides the powerful social publishing and analytics tools you need to monitor key brand health metrics like sentiment and share of voice directly from your content calendar. Start making data-driven decisions today with Schedul.
No credit card required!